Ambient Air Monitoring
Ambient air monitoring is the systematic, long-term assessment of pollutant levels by measuring the quantity and types of certain pollutants in the surrounding, outdoor air.
The Air Monitoring section of the AVAQMD is charged with monitoring the ambient (outside) air, in compliance with the Federal Clean Air Act and California air pollution laws. The California Air Resources Board (ARB) maintains a website with technical information on all of monitoring stations operated throughout the state, including within the AVAQMD's boundaries.
There are certain pollutants that are found almost everywhere that are harmful to humans if their concentration in the ambient air is above certain levels. In the United States, National Ambient Air Quality Standards (NAAQS) have been set for each of these pollutants.
These standards include the following six pollutants: particulate matter(PM), sulfur dioxide (SO2), nitrogen dioxide(NO2), carbon monoxide(CO), photochemical oxidants(O3), and lead(Pb).
For each criteria pollutant except carbon monoxide, both primary and secondary standards have been established. The primary standards are set at levels that protect public health. If the ambient concentrations of those pollutants remain below their primary NAAQS, it is believed that the most sensitive member of the public will not be harmed by breathing the air. The secondary standards are set at levels that protect public welfare. This means that if concentrations remain below the secondary standards, crops, buildings, etc., will not be damaged. Continuously monitoring the air tells us whether or not we are "in compliance" with these standards.--source: Environmental Resource Guide-Air Quality.
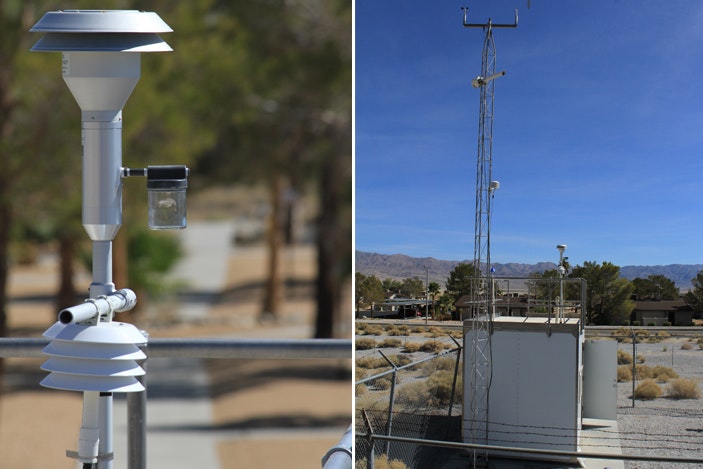
AVAQMD maintains an air monitoring station in Lancaster. This station collects information 24 hours a day, seven days a week on the ambient levels of pollutants, including ozone, particulate matter, nitrogen oxides, sulfur oxides, and carbon monoxide. After validation, this data becomes part of a national air quality database, Air Quality System (AQS) that is maintained by the Environmental Protection Agency. You can view the 2021 Annual Network Plan with appendices here, including the AVAQMD air monitoring site information.
Ambient air monitoring is an integral part of an effective air quality management system. Reasons to collect such data include to:
- assess the extent of pollution;
- provide air pollution data to the general public in a timely manner;
- support implementation of air quality goals or standards;
- evaluate the effectiveness of emissions control strategies;
- provide information on air quality trends;
- provide data for the evaluation of air quality models; and
- support research (e.g., long-term studies of the health effects of air pollution).
There are different methods to measure any given pollutant. A developer of a monitoring strategy should examine the options to determine which methods are most appropriate, taking into account the main uses of the data, initial investment costs for equipment, operating costs, reliability of systems, and ease of operation.
The locations for monitoring stations depend on the purpose of the monitoring. Most air quality monitoring networks are designed to support human health objectives, and monitoring stations are established in population centers. They may be near busy roads, in city centers, or at locations of particular concern (e.g., a school, hospital, particular emissions sources). Monitoring stations also may be established to determine background pollution levels, away from urban areas and emissions sources.
Systems are needed to ensure that data are of acceptable quality, to record and store the data, and to analyze the data and present results.
Particulate Matter (PM10)
PM10 refers to particles with an aerodynamic diameter of 10 microns or smaller. For comparison, the diameter of a human hair is about 50 to 100 microns.
Exposure to PM10 aggravates a number of respiratory illnesses and may even cause early death in people with existing heart and lung disease.
PM10 includes the subgroup of finer particles with aerodynamic diameter of 2.5 microns and smaller (PM2.5). These finer particles pose an increased health risk because they can deposit deep in the lung and contain substances that are particularly harmful to human health.
PM is a mixture of substances that include elements such as carbon and metals; compounds such as nitrates, organic compounds, and sulfates; and complex mixtures such as diesel exhaust and soil. These substances may occur as solid particles or liquid droplets. Some particles are emitted directly into the atmosphere. Others, referred to as secondary particles, result from gases that are transformed into particles through physical and chemical processes in the atmosphere.
PM Program
In addition to monitoring gaseous pollutants in the air, the AVAQMD also monitors the presence of microscopic solids that are suspended in the lower atmosphere. The presence of soot, ash or dust can have an effect on human health and produce haze that and may significantly reduce visibility. In the case of blowing dust or sand, "fugitive" particulate matter can damage property as well.
Particulate matter, or "PM" is divided into three classes based on size, ranging from PM-10, particles less than 10 microns in diameter to PM-2.5, or particles less then 2.5 microns in diameter. Generally, exposure to the smallest of particles has the greater effect on health and can have a significant effect on persons who have have respiratory problems.
PM10 and PM2.5 Sampling
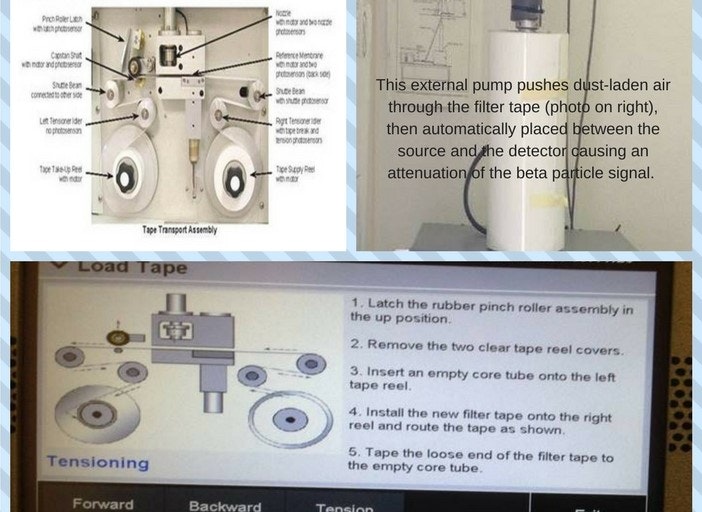
The AVAQMD currently uses the Met One Instrument model BAM-1020, which automatically measures and records airborne particulate concentration levels using the principle of beta ray attenuation. This method provides a simple determination of concentration in units of milligrams or micrograms of particulate per cubic meter of air. A small C-14 (Carbon 14) element emits a constant source of high-energy electrons known as beta particles. These beta particles are detected and counted by a sensitive scintillation detector. An external pump pulls a measured amount of dust-laden air through a filter tape. After the filter tape is loaded with ambient dust, it is automatically placed between the source and the detector thereby causing an attenuation of the beta particle signal. The degree of attenuation of the beta particle signal is used to determine the mass concentration of particulate matter on the filter tape, and hence the volumetric concentration of particulate matter in ambient air.
Until only recently, the real time collection and quantitative reporting of these substances was not possible, but the AVAQMD, with the help of the State of California EPA, was able to replace aging instrumentation to start collecting hourly data.
It's All About the Data
An immense amount of meteorological data has been collected since the first weather observation was made. Atmospheric data is constantly being collected by governments and their agencies as well as private concerns around the world. Certainly everyone is aware of the hazards present in severe weather and in many cases the rapid public dissemination of such information in the form of a "Weather Warning" can be a matter of life and death.
Because of an increasing interest in the state of our environment and the quality of our air, the science of data collection and the disposition of such data has been redefined in the few past years. While the effects of air pollution may not be as immediately spectacular as a tornado, or hurricane, the long term effects on populations, and certain more sensitive segments of those populations, can nonetheless be hazardous to health and well being.
Whereas weather data has traditionally been gathered by human observers, the quality of our air by its very nature, must be determined by instrumentation. Prior to the year 2000, air quality data, once gathered, was and still is assessed for its accuracy and submitted to the EPA to be stored in a database. This data is used to to fuel studies to determine how the movement of the atmosphere affects the properties of various pollutant gases, and in turn, what the effect these gases might have on the population as a whole. A new discipline, defined as "modeling" has grown out of this; scientists, armed with computers and sophisticated software attempt to create a vision of how our atmosphere might be transformed in the future.
Since the year 2000, air quality data has become available to the public in a near real time sense. Informing people as to how atmospherics and air pollution might affect every day activities has become a priority with the Environmental Protection Agency. Heretofore, the lack of truly reliable instrumentation and the lack of a communications conduit, has made outreach to the public nearly impossible. Technological advances however, have made instrumentation more reliable and the Internet has provided a practical means to transmit data from remote locations on an hourly basis to a central location for distribution.
Meteorologists and Modelers now have immediate data at their disposal and this facilitates the generation of more accurate and timely air quality forecasts. The EPA's AirNow web site gives the public a wide selection of air quality data products.
The Antelope Valley Air Quality Management District has been on the cutting edge of software development that facilitates hourly data collection and enables the district to participate in the "Ozone Mapping" program. This program illustrates near - real time ozone data in a graphical format from air quality districts nation wide.
Our public outreach efforts have become more effective as data collection has become more reliable. As technology continues to advance, the media and the public's interest in detailed air quality data and forecasts alongside their regularly scheduled weather forecasts has grown by leaps and bounds.